Protein Phylogeny
This page was produced as an assignment for Genetics 564, an undergraduate course at UW-Madison.
This page was produced as an assignment for Genetics 564, an undergraduate course at UW-Madison.
What is phylogeny?
According to the Encyclopedia Britannica, phylogeny is defined as the history of the evolution of a species or a group. The study of phylogeny utilizes the idea that all species have descended from one common ancestor, and variations from the common ancestor are changes due to evolution. In addition to these variations, the similarities between organisms are noteworthy as well. Various algorithms have been developed to calculate the amount of similarity between whole organisms, as well as smaller molecules like proteins and DNA. The phylogenetic tree is the best way to show the relatedness of these organisms; a sample tree is shown on the right.
Some basic vocabulary is necessary to describe phylogenetic trees. The root represents the common ancestor for all organisms in the tree. A node is a taxonomic unit, which means it can represent an organism or a common ancestor. Branches represent the genetic relationships between the organisms on the tree. In these simple trees, a taxon describes a single species that is acknowledged as a unit, and a clade is a group of organisms that come from a common ancestor. The topology of the tree describes the particular branching patterns of the tree as a whole.
Phylogeny of the XPA protein
Phylogeny of the XPA protein was studied using algorithms through the The European Bioinformatics Institute at the European Molecular Biology Laboratory (referred to as EMBL-EBI). The three algorithms used were TCoffee, Clustal Omega, and MUSCLE. All three trees are clustered using neighbor joining and are calculated using percent identity. Neighbor joining methodology uses an algorithm that calculates the shortest branch lengths, and the percent identity (PID) is calculated using the formula PID = (Number of equivalent aligned non-gap symbols * 100) / (Smallest number of non-gap positions in either of both sequences). [1] The program that calculated these trees was Jalview. [2]
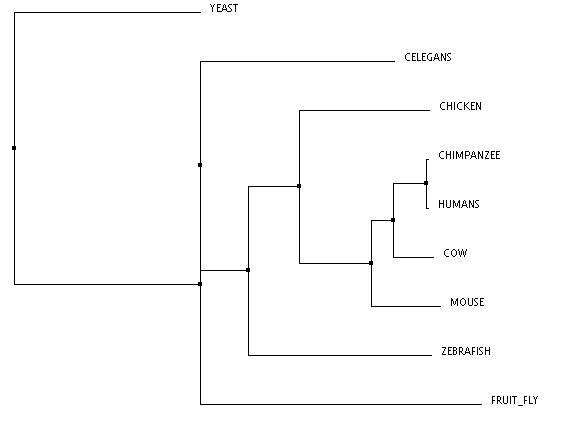
TCoffee (click to enlarge)
|
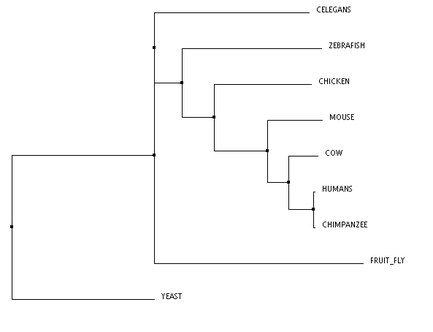
Clustal Omega (click to enlarge)
|
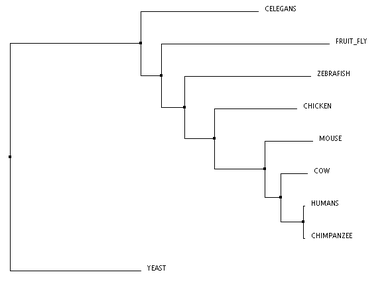
MUSCLE (click to enlarge)
Discussion
These phylogenetic trees show some variability across the different algorithms, however, there are a few notable commonalities. The chimpanzee and human are the only two organisms to form a clade, and this is consistent across all three trees. This makes sense, because the predicted DNA repair protein complementing XP-A cells in chimpanzees is 99% identical to the human homolog. Conversely, the yeast taxon is completely removed in comparison to the remaining organisms, and this is also found in all three trees. This result fits with the data well, as the yeast homolog is only 31% identical to the human homolog. The distinct removal in the tree suggests that there is an amino acid change in the yeast homolog that is significantly different from the others. The order of remaining organisms is logical as well, with the mammals being most closely related, followed by the remaining vertebrates, and finally, invertebrates.
These phylogenetic trees show some variability across the different algorithms, however, there are a few notable commonalities. The chimpanzee and human are the only two organisms to form a clade, and this is consistent across all three trees. This makes sense, because the predicted DNA repair protein complementing XP-A cells in chimpanzees is 99% identical to the human homolog. Conversely, the yeast taxon is completely removed in comparison to the remaining organisms, and this is also found in all three trees. This result fits with the data well, as the yeast homolog is only 31% identical to the human homolog. The distinct removal in the tree suggests that there is an amino acid change in the yeast homolog that is significantly different from the others. The order of remaining organisms is logical as well, with the mammals being most closely related, followed by the remaining vertebrates, and finally, invertebrates.
| xpa_protein_fasta_sequences.docx |
References
Algorithms used: Clustal Omega, MUSCLE, and TCOFFEE
1. Jalview. http://www.jalview.org/help/html/calculations/tree.html. Accessed February 19, 2014.
2. Waterhouse, A.M., Procter, J.B., Martin, D.M.A, Clamp, M., Barton, G.J (2009), "Jalview version 2: A Multiple Sequence Alignment and Analysis Workbench," Bioinformatics 25 (9) 1189-1191 doi: 10.1093/bioinformatics/btp033. Accessible from http://www.ncbi.nlm.nih.gov/pubmed/19151095.
Site Created By: Sarah Drewes
Contact: [email protected]
Last Modified: 05/18/14
University of Wisconsin-Madison
Contact: [email protected]
Last Modified: 05/18/14
University of Wisconsin-Madison
